




7.3.1 Energy Usage per Square Metre
Measuring Energy Efficiency Across the Built Environment
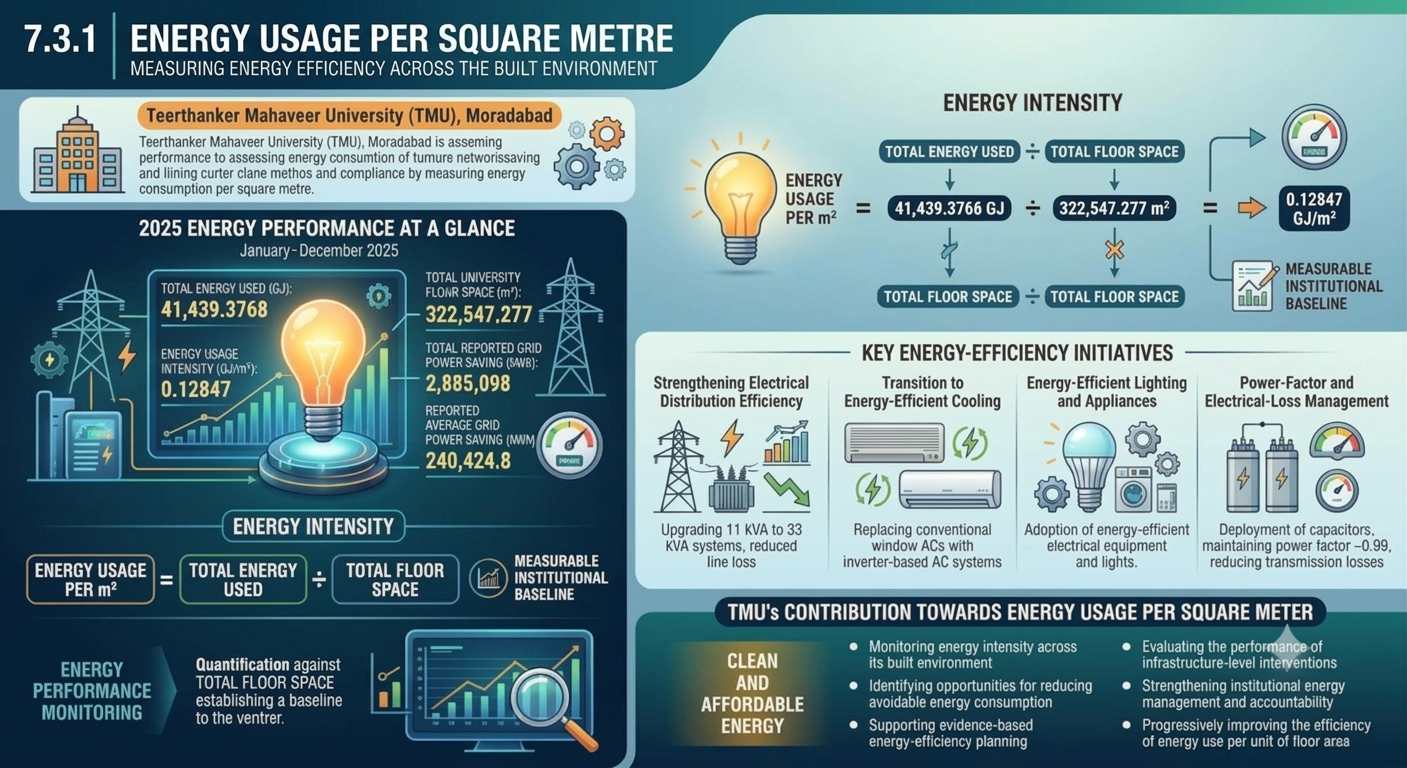
TMU assesses institutional energy performance by measuring energy consumption per square metre of floor space, providing a standardized measure of how efficiently the University’s built environment uses energy.
2025 Energy Performance at a Glance
TMU monitors institutional energy performance through the assessment of energy consumption in relation to its total floor space. This provides a standardized basis for understanding energy utilization across the built environment and supports evidence-based evaluation of energy efficiency. During the reported period of January 2025 to December 2025, TMU documented total energy usage of 41,439.3768 GJ, against a total university floor space of 322,547.277 m².
| Data Collected | Value |
|---|---|
| Total Energy Used (In Gigajoules) | 41,439.3768 GJ |
| University Floor Space (In Sqm) | 322,547.277 m² |
| Quantitative Parameter | Reported Value |
|---|---|
| Reporting Period | Jan 2025 – Dec 2025 |
| Total Grid Power Saving | 2,885,098 kWh |
| Reported Average Grid Power Saving | 240,424.8 kWh |
Energy Intensity Calculation
The resulting value of 0.12847 GJ/m² establishes TMU's empirical baseline for evaluating institutional energy performance across all constituent colleges and campus facilities.
Comparative Energy Performance (Year 2024 vs Year 2025)
The energy performance data demonstrates a significant improvement in institutional energy efficiency between 2024 and 2025. Despite maintaining the same university floor area of 322,547.28 m², TMU substantially reduced its total energy consumption and energy intensity, reflecting the effectiveness of energy conservation measures, technological upgrades and the university's transition towards more sustainable energy management.
Comparative Energy Performance: 2024 vs 2025
| Data Collected | Value (Year 2024) | Value (Year 2025) | Trend |
|---|---|---|---|
| Total Energy Used (In Giga Joule) | 62,982.1764 | 41,439.3768 | -34.2% |
| University Floor Space (In Sqm) | 322,547.28 | 322,547.28 | Constant |
| Energy Usage per Sqm (GJ/m²) | 0.19526 | 0.12847 | -34.2% |
Comparative Interpretation of Energy Performance
| Performance Indicator | 2024 Baseline | 2025 Performance | Improvement / Outcome |
|---|---|---|---|
| Total Energy Consumption (GJ) | 62,982.1764 | 41,439.3768 | 21,542.7996 GJ reduction |
| University Floor Space (m²) | 322,547.28 | 322,547.28 | No change (constant area) |
| Energy Intensity (GJ/m²) | 0.19526 | 0.12847 | 34.20% reduction |
Interpretation: Total energy consumption declined from 62,982.18 GJ in 2024 to 41,439.38 GJ in 2025, representing an absolute reduction of 21,542.80 GJ, equivalent to approximately 34.20%. More importantly, energy intensity decreased from 0.19526 to 0.12847 GJ/m², indicating that the university is using substantially less energy to operate the same built-up area. This improvement in energy intensity is particularly significant because it demonstrates enhanced operational efficiency rather than an apparent reduction arising from a smaller institutional infrastructure.
Financial Impact: Energy Conservation and Monetary Savings
The University's energy conservation initiatives have also generated substantial financial benefits. The reported savings for two consecutive 18-month periods demonstrate ongoing financial optimization:
| Assessment Period | Duration | Reported Monetary Savings |
|---|---|---|
| July 2023 – December 2024 | 18 months | ₹4,75,68,041 |
| January 2025 – June 2026 | 18 months | ₹4,91,08,783 |
| Additional Savings in Latest Period | +3.24% Growth | +₹15,40,742 |
Interpretation: The reported financial savings increased from ₹4.76 crore to ₹4.91 crore across two comparable 18-month periods. This represents an additional saving of ₹15.41 lakh, or approximately 3.24%, during January 2025–June 2026. The financial outcome demonstrates the economic value of sustained energy management, efficient electrical infrastructure, improved energy utilisation and conservation-oriented investments.
Key Energy-Efficiency Initiatives
Our energy management approach incorporates infrastructure-level and operational interventions designed to reduce avoidable energy losses and improve the efficiency of electricity consumption:
Strengthening Electrical Distribution Efficiency
Upgrading the electrical distribution system, including the use of a 33 kVA system in place of the earlier 11 kVA arrangement, supports more efficient power distribution and contributes to the reduction of transmission and line losses.
Transition to Energy-Efficient Cooling
Conventional window air conditioning systems are being replaced with energy saving inverter-based air conditioning systems. The transition is intended to reduce electricity demand associated with cooling while improving operational efficiency.
Energy-Efficient Lighting and Appliances
The progressive adoption of energy-efficient electrical equipment and lighting technologies supports reduced electricity demand and contributes to improved energy performance across institutional facilities.
Power-Factor and Electrical-Loss Management
Measures such as the deployment of capacitors to maintain a power factor of approximately 0.99 support more efficient electrical utilization and help minimize avoidable transmission-related losses.
Energy Performance Monitoring
Quantification of energy consumption against total floor space establishes a measurable baseline through which future energy-efficiency interventions can be evaluated using a consistent indicator across all university facilities.
Our Contribution Towards Energy Usage per Square Metre
The measurement and management of energy intensity directly supports the objectives of clean and affordable energy, particularly the pursuit of improved energy efficiency and more sustainable energy use. By establishing a measurable GJ/m² baseline, TMU creates a foundation for: